Graphic source: https://onlinelibrary.wiley.com/doi/10.1111/add.16318

Graphic source: https://www.nbcnews.com/health/health-news/fentanyl-stimulants-drives-fourth-wave-overdose-epidemic-us-rcna104953

Graphic source:https://www.samhsa.gov/data/sites/default/files/reports/rpt39474/Non-Fatal%20Overdoses%20Short%20Report%20Mar22%20Final.pdf

Graphic source:https://www.samhsa.gov/data/sites/default/files/reports/rpt39474/Non-Fatal%20Overdoses%20Short%20Report%20Mar22%20Final.pdf

Map source: https://sanjaybasu.shinyapps.io/opioid_geographic/
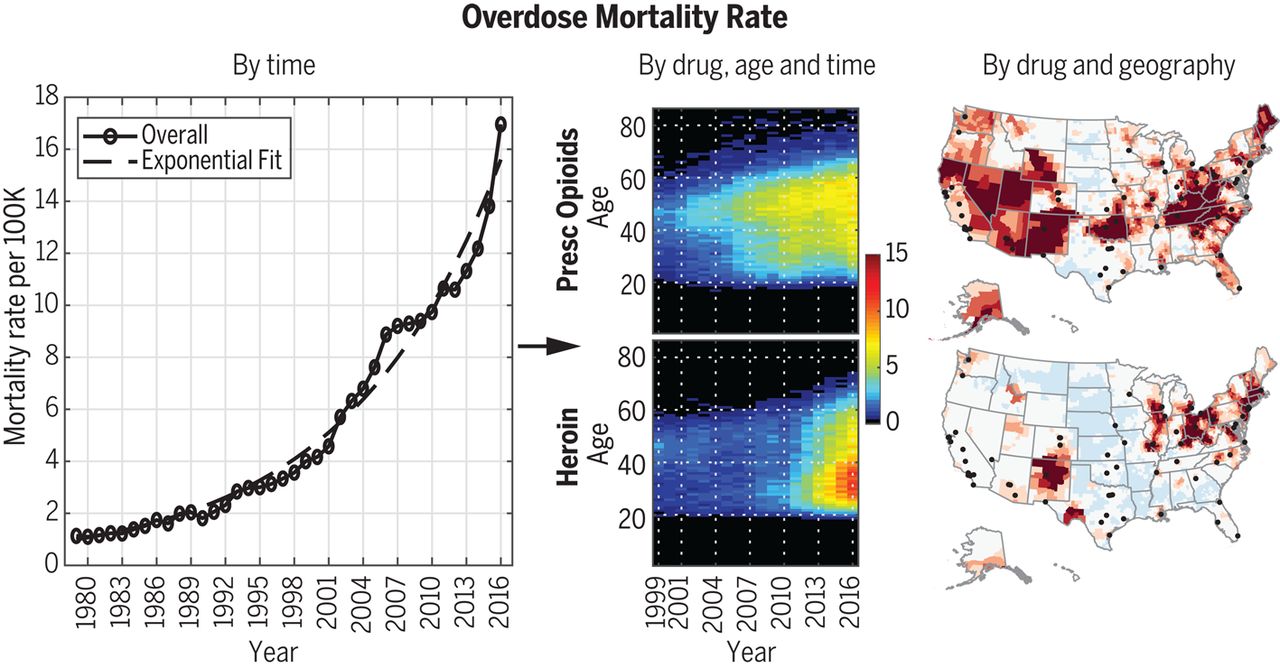
Synthetic Opioid Deaths: Darker colors represent more rapid mortality rates from synthetic opioids (JAMA, 2/2019).

Map source: https://www.medpagetoday.com/neurology/opioids/78170. Image provided by researchers Kiang, Basu, Chen, and Alexander and used in JAMA Network Open.

Map source: https://www.nbcnews.com/news/us-news/opioids-claiming-more-african-american-lives-overdoses-spread-rust-belt-n974261

Graphic source: https://www.cdc.gov/drugoverdose/epidemic/index.html

Graphic source: https://www.cdc.gov/drugoverdose/epidemic/index.html
Graphic source:
http://science.sciencemag.org/content/361/6408/eaau1184


Graphic source: https://www.cdc.gov/phpr/pubs-links/2018/documents/2018_Preparedness_Report.pdf

Graphic source: https://www.cdc.gov/nchs/data/nvsr/nvsr65/nvsr65_10.pdf"

Graphic source: https://www.cdc.gov/mmwr/volumes/67/wr/mm6731a2.htm

Graphic source: http://www.businessinsider.com/the-stigma-against-using-heroin-is-going-away-2016-2

Graphic source: https://www.bjs.gov/content/pub/pdf/dudaspji0709.pdf

Graphic source:
http://www.npr.org/sections/health-shots/2017/06/12/523774660/a-drugmaker-tries-to-cash-in-on-the-opioid-epidemic-one-state-law-at-a-time

Graphic source: https://www.cdc.gov/nchs/data/nvsr/nvsr65/nvsr65_10.pdf

Graphic source: https://www.vox.com/2015/10/1/9433099/opioid-painkiller-heroin-epidemic

Graphic source: https://www.vox.com/2015/10/1/9433099/opioid-painkiller-heroin-epidemic

Graphic source: https://www.bjs.gov/content/pub/pdf/fjs1314.pdf

Map source: https://www.cdc.gov/nchs/data/hpdata2020/HP2020MCR-C40-SA.pdf

Map source: https://www.cdc.gov/nchs/data/hpdata2020/HP2020MCR-C40-SA.pdf
Rates of Drug Overdose Deaths Involving Heroin,* by Selected Age Groups United States, 2006-2015

Graphic source: https://www.cdc.gov/mmwr/volumes/65/wr/mm6552a12.htm

Graphic source:
http://i0.wp.com/media4.s-nbcnews.com/j/newscms/2016_51/1839746/drug_overdose_deaths_in_2014_deaths_chartbuilder_c3fa06fa447dd8dfab2d4afe588ef2dd.nbcnews-ux-2880-1000.png

Graphic source: http://kff.org/other/state-indicator/opioid-overdose-deaths-by-age-group/?currentTimeframe=0 Created by bcjung

Graphic source: http://kff.org/other/state-indicator/opioid-overdose-deaths-by-raceethnicity/?currentTimeframe=0 Created by bcjung

Graphic source: https://jamanetwork.com/journals/jama/fullarticle/2657548

Map source: http://recoverybrands.com/drugs-in-america-vs-europe/assets/images/xdrug-overdose-deaths-per-year.png.pagespeed.ic.Nd2dGPqSBF.png

Graphic source:https://www.cdc.gov/drugoverdose/data/analysis.html