Graphic source: https://www.cdc.gov/hiv/group/msm/bmsm.html

Graphic source: https://www.statista.com/chart/16915/new-hiv-diagnoses-united-states/
New HIV Diagnoses in the United States for the Most-Affected Subpopulations, 2016

Graphic source: https://www.cdc.gov/hiv/statistics/overview/ataglance.html
Estimates of New HIV Infections in the United States for the Most-Affected Subpopulations, 2010

Graphic source: http://www.cdc.gov/hiv/group/msm/index.html

Graphic source: https://www.cdc.gov/hiv/library/awareness/ngmhaad.html

Graphic source: https://www.cdc.gov/hiv/library/awareness/ngmhaad.html
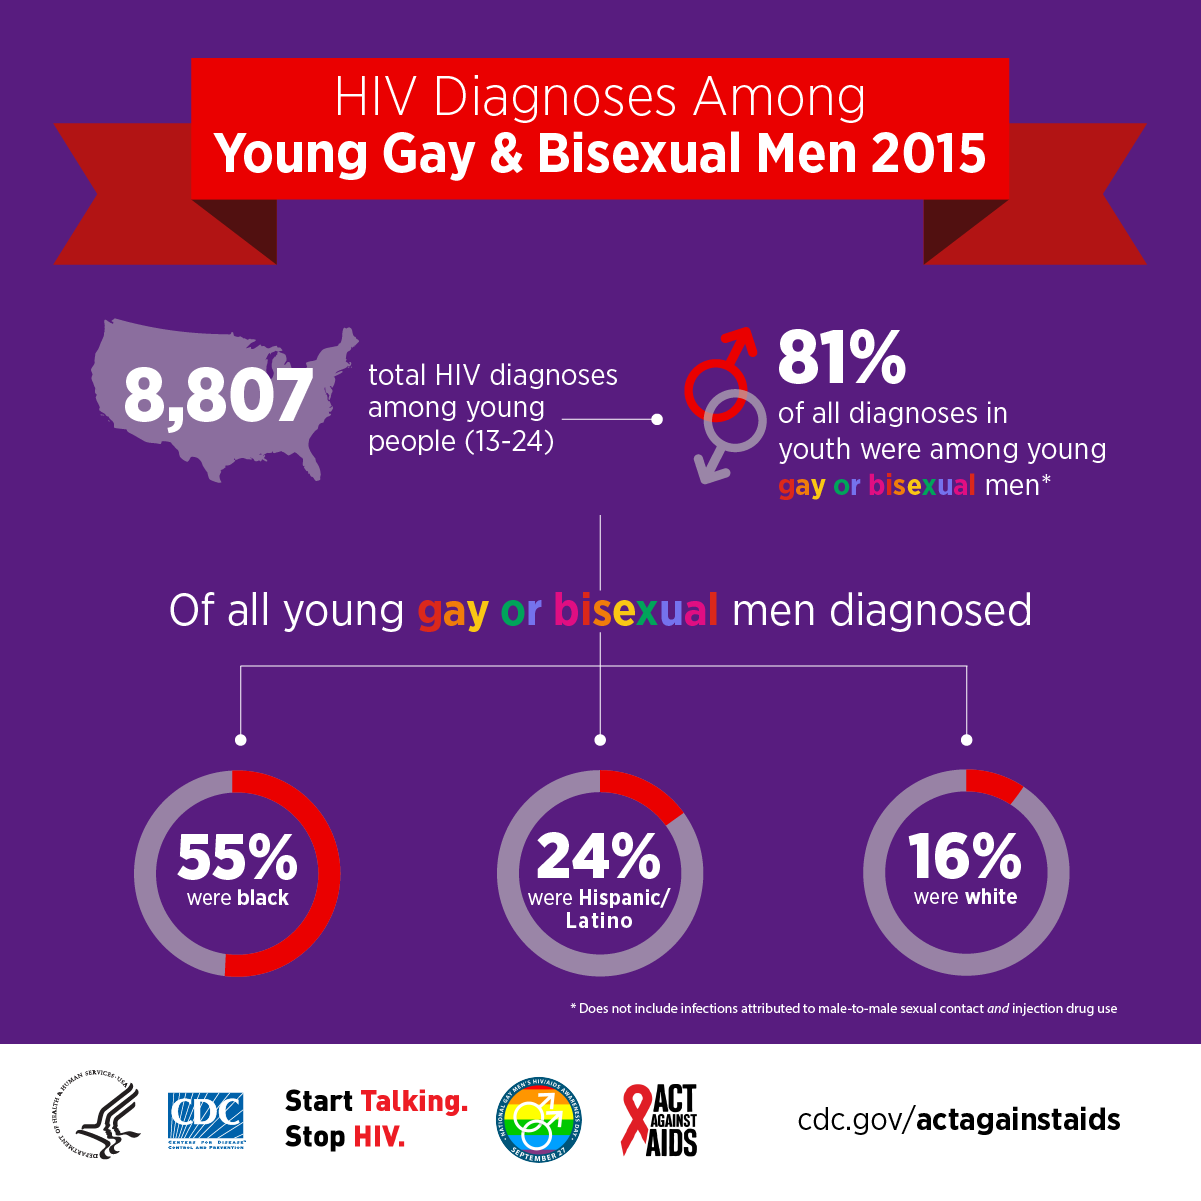
https://www.cdc.gov/hiv/library/awareness/ngmhaad.html #NGMHAAD
For more information, see HIV Among Gay and Bisexual Men CDC.gov

Map source: http://abcnews.go.com/Health/map-reveals-hiv-risk-greatest-southern-cities-gay/story?id=39167798


 We Track That!