
https://www.bettycjung.net/Cvdindex.htm


|
 |
 |
 |

|

|

| Chronic Disease Index | CVD - General | CVD - Specific | Cancer | Diabetes | Health Info Index |
| Fitness | Nutrition | Obesity | Sleep | Tobacco |
|

Custom Search
|
|
|
Custom Search
|

Know Your Chances: Interactive Risk Charts to Put Cancer in Context
Risk charts present these basic facts by showing the chance of dying from a variety of cancer and other diseases over specific time frames. Because age, sex and race are so important in determining your chances, the charts let you account for these factors. While other factors make an important difference (like smoking or having a serious disease run in your family), the numbers from the charts will get you into the right ballpark.
The relationship between birth month and disease incidence in 1.7 million patients. Good news if you were born in May. Not so much if you were an October baby. (Graphic: Columbia University Medical Center)

Graphic source:
https://www.yahoo.com/lifestyle/study-finds-how-your-birth-month-affects-your-121189699487.html
The incidence of disease per birth month, which shows higher incidences in those with earlier birthdays. (Graphic: Columbia University Medical Center)

Graphic source:
https://www.yahoo.com/lifestyle/study-finds-how-your-birth-month-affects-your-121189699487.html
The number of disease associations per birth month. (Graphic: Columbia University Medical Center)

Graphic source:
https://www.yahoo.com/lifestyle/study-finds-how-your-birth-month-affects-your-121189699487.html
The average life span for each birth month, which shows that those born in the first half of the year tend to have shorter lives. (Graphic: Columbia University Medical Center)

Graphic source:
https://www.yahoo.com/lifestyle/study-finds-how-your-birth-month-affects-your-121189699487.html

Graphic source: https://bsky.app/profile/ourworldindata.org/post/3mftq3rpa2u2a

Graphic source: https://www.nccih.nih.gov/research/resources/the-whole-person-health-index-a-new-tool-for-human-mechanistic-and-clinical-studies
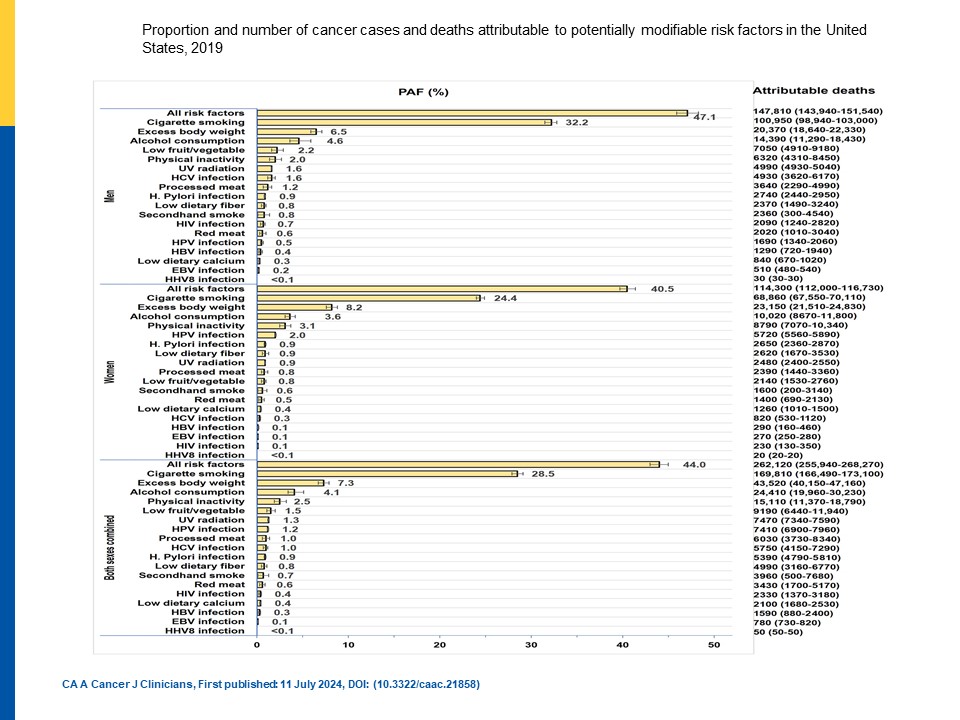
Graphic source:
https://acsjournals.onlinelibrary.wiley.com/doi/full/10.3322/caac.21858

Graphic source: https://www.bmj.com/content/380/bmj-2022-072691

Graphic source: https://jamanetwork.com/journals/jamanetworkopen/fullarticle/2793916

Graphic source: https://www.pewresearch.org/global/2021/11/18/what-makes-life-meaningful-views-from-17-advanced-economies/

Graphic source: https://www.pewresearch.org/global/2021/11/18/what-makes-life-meaningful-views-from-17-advanced-economies/

Graphic source: https://www.pewresearch.org/fact-tank/2021/11/23/what-makes-life-meaningful-globally-answers-sometimes-vary-by-age/


Graphic source; https://www.mckinsey.com/featured-insights/europe/well-being-in-europe-addressing-the-high-cost-of-covid-19-on-life-satisfaction

Graphic source; https://www.mckinsey.com/featured-insights/europe/well-being-in-europe-addressing-the-high-cost-of-covid-19-on-life-satisfaction

Graphic source: https://cosmosmagazine.com/the-future/apps-may-soon-be-able-to-predict-your-life-expectancy
How an individual's life expectancy might change between two points in time (F and H) following a lifestyle improvement, such as weight loss.

Graphic source:https://www.rsph.org.uk/about-us/news/instagram-ranked-worst-for-young-people-s-mental-health.html

Graphic source: https://priceonomics.com/the-states-with-the-worst-eating-and-exercise/

Graphic source: https://priceonomics.com/the-states-with-the-worst-eating-and-exercise/

Graphic source: https://priceonomics.com/the-states-with-the-worst-eating-and-exercise/

Graphic source: https://informationisbeautiful.net/visualizations/what-could-really-increase-life-expectancy-lifespan-and-longevity
A schematic model of the intermediary mechanisms for dyslipidemia, insulin resistance, T2DM, heart disease, hypertension, some forms of cancer, OSA, NAFLD, and osteoarthritis.

Graphic source: https://academic.oup.com/edrv/article/39/2/79/4922247
"The authors highlighted 12 risk factors with strong evidence of being causally related to dementia onset: low education, hearing loss, traumatic brain injury (TBI), hypertension, excessive alcohol consumption, obesity, smoking, depression, social isolation, physical inactivity, diabetes, and air pollution. Using risk ratios from meta-analyses and global prevalence estimates of each risk factor, the authors of the report estimated that up to 40% of dementia cases worldwide were associated with these 12 risk factors."

U.S. Adults Have the Highest Chronic Disease Burden (%).

Source: Katelyn Jetelina/Commonwealth Fund
Epidemiology of chronic diseases. Chronic diseases are a major burden in the U.S. But contrary to popular belief, most are either declining or stable, not increasing.

Graphic source: Katelyn Jetelina/Dementia Study; Diabetes; Heart disease; Obesity; Cancer

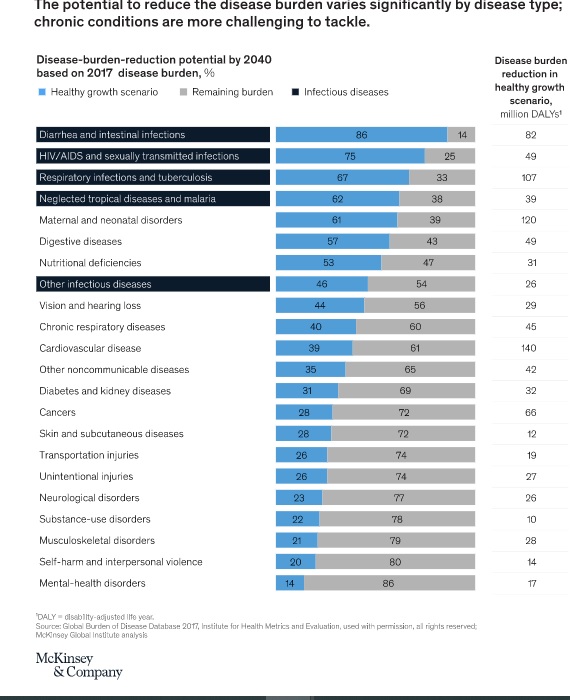
Graphic source: https://www.mckinsey.com/mhi/our-insights/adding-years-to-life-and-life-to-years
Graphic source: https://www.mckinsey.com/industries/healthcare-systems-and-services/our-insights/prioritizing-health-a-prescription-for-prosperity

Chronic Care Model
Chronic Disease Data
AGE WELL: On average, as this chart reveals, chronic diseases increase with aging, which makes the elderly more susceptible to COVID-19. This deadly combination is a stark reminder, again, of doing our best to stay healthy.

Graphic course: http://nautil.us/issue/84/outbreak/how-covid_19-picks-on-the-weakened. Aging and the Epidemiology of Multimorbidity

Graphic source: https://www.who.int/ageing/publications/global_health.pdf

Graphic source: http://www.bmj.com/content/357/bmj.j2765

Graphic source: http://www.cdc.gov/pcd/issues/2016/16_0211.htm

Graphic source: http://www.cdc.gov/pcd/issues/2016/16_0211.htm
Chronic Disease Statistics


Graphic source: http://www.medscape.org/viewarticle/873021
Cause of disability-adjusted life-years in all nations. (IHME)

Graphic source: http://www.theatlantic.com/health/archive/2016/10/how-back-pain-took-over-the-world/503243/
Cause of disability-adjusted life-years in rich nations. (IHME)
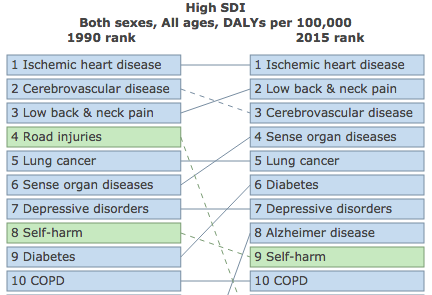
Graphic source: http://www.theatlantic.com/health/archive/2016/10/how-back-pain-took-over-the-world/503243/

Chronic Disease Indicators
Chronic Disease Data, by State
Determinants of Health

Graphic source: https://www.kff.org/coronavirus-covid-19/issue-brief/tracking-social-determinants-of-health-during-the-covid-19-pandemic/

Graphic source: https://jamanetwork.com/data/Journals/JAMA/936804/jsc180001f4.png and https://jamanetwork.com/journals/jama/fullarticle/2674671

Noninfectious Diseases & Conditions
Risk Factors


Graphic source: https://www.yahoo.com/health/study-finds-how-your-birth-month-affects-your-121189699487.html
Risk Factor Data, by State
Intergenerational Impact, by State
Cardiovascular Disease -General
Cardiovascular Disease - Specific Diseases
Chronic Disease Resources
| Betty's Home Page | Site Map | Public Health Documents | Public Health Data | Public Health Sites A to Z Index | Search Engines Index |


© Copyright 1999 - 2026 Betty C. Jung
All rights reserved.