Graphic source: https://jamanetwork.com/journals/jama/fullarticle/2822992?guestAccessKey=ae7e69d2-9079-45f6-9143-782c809c07e7">

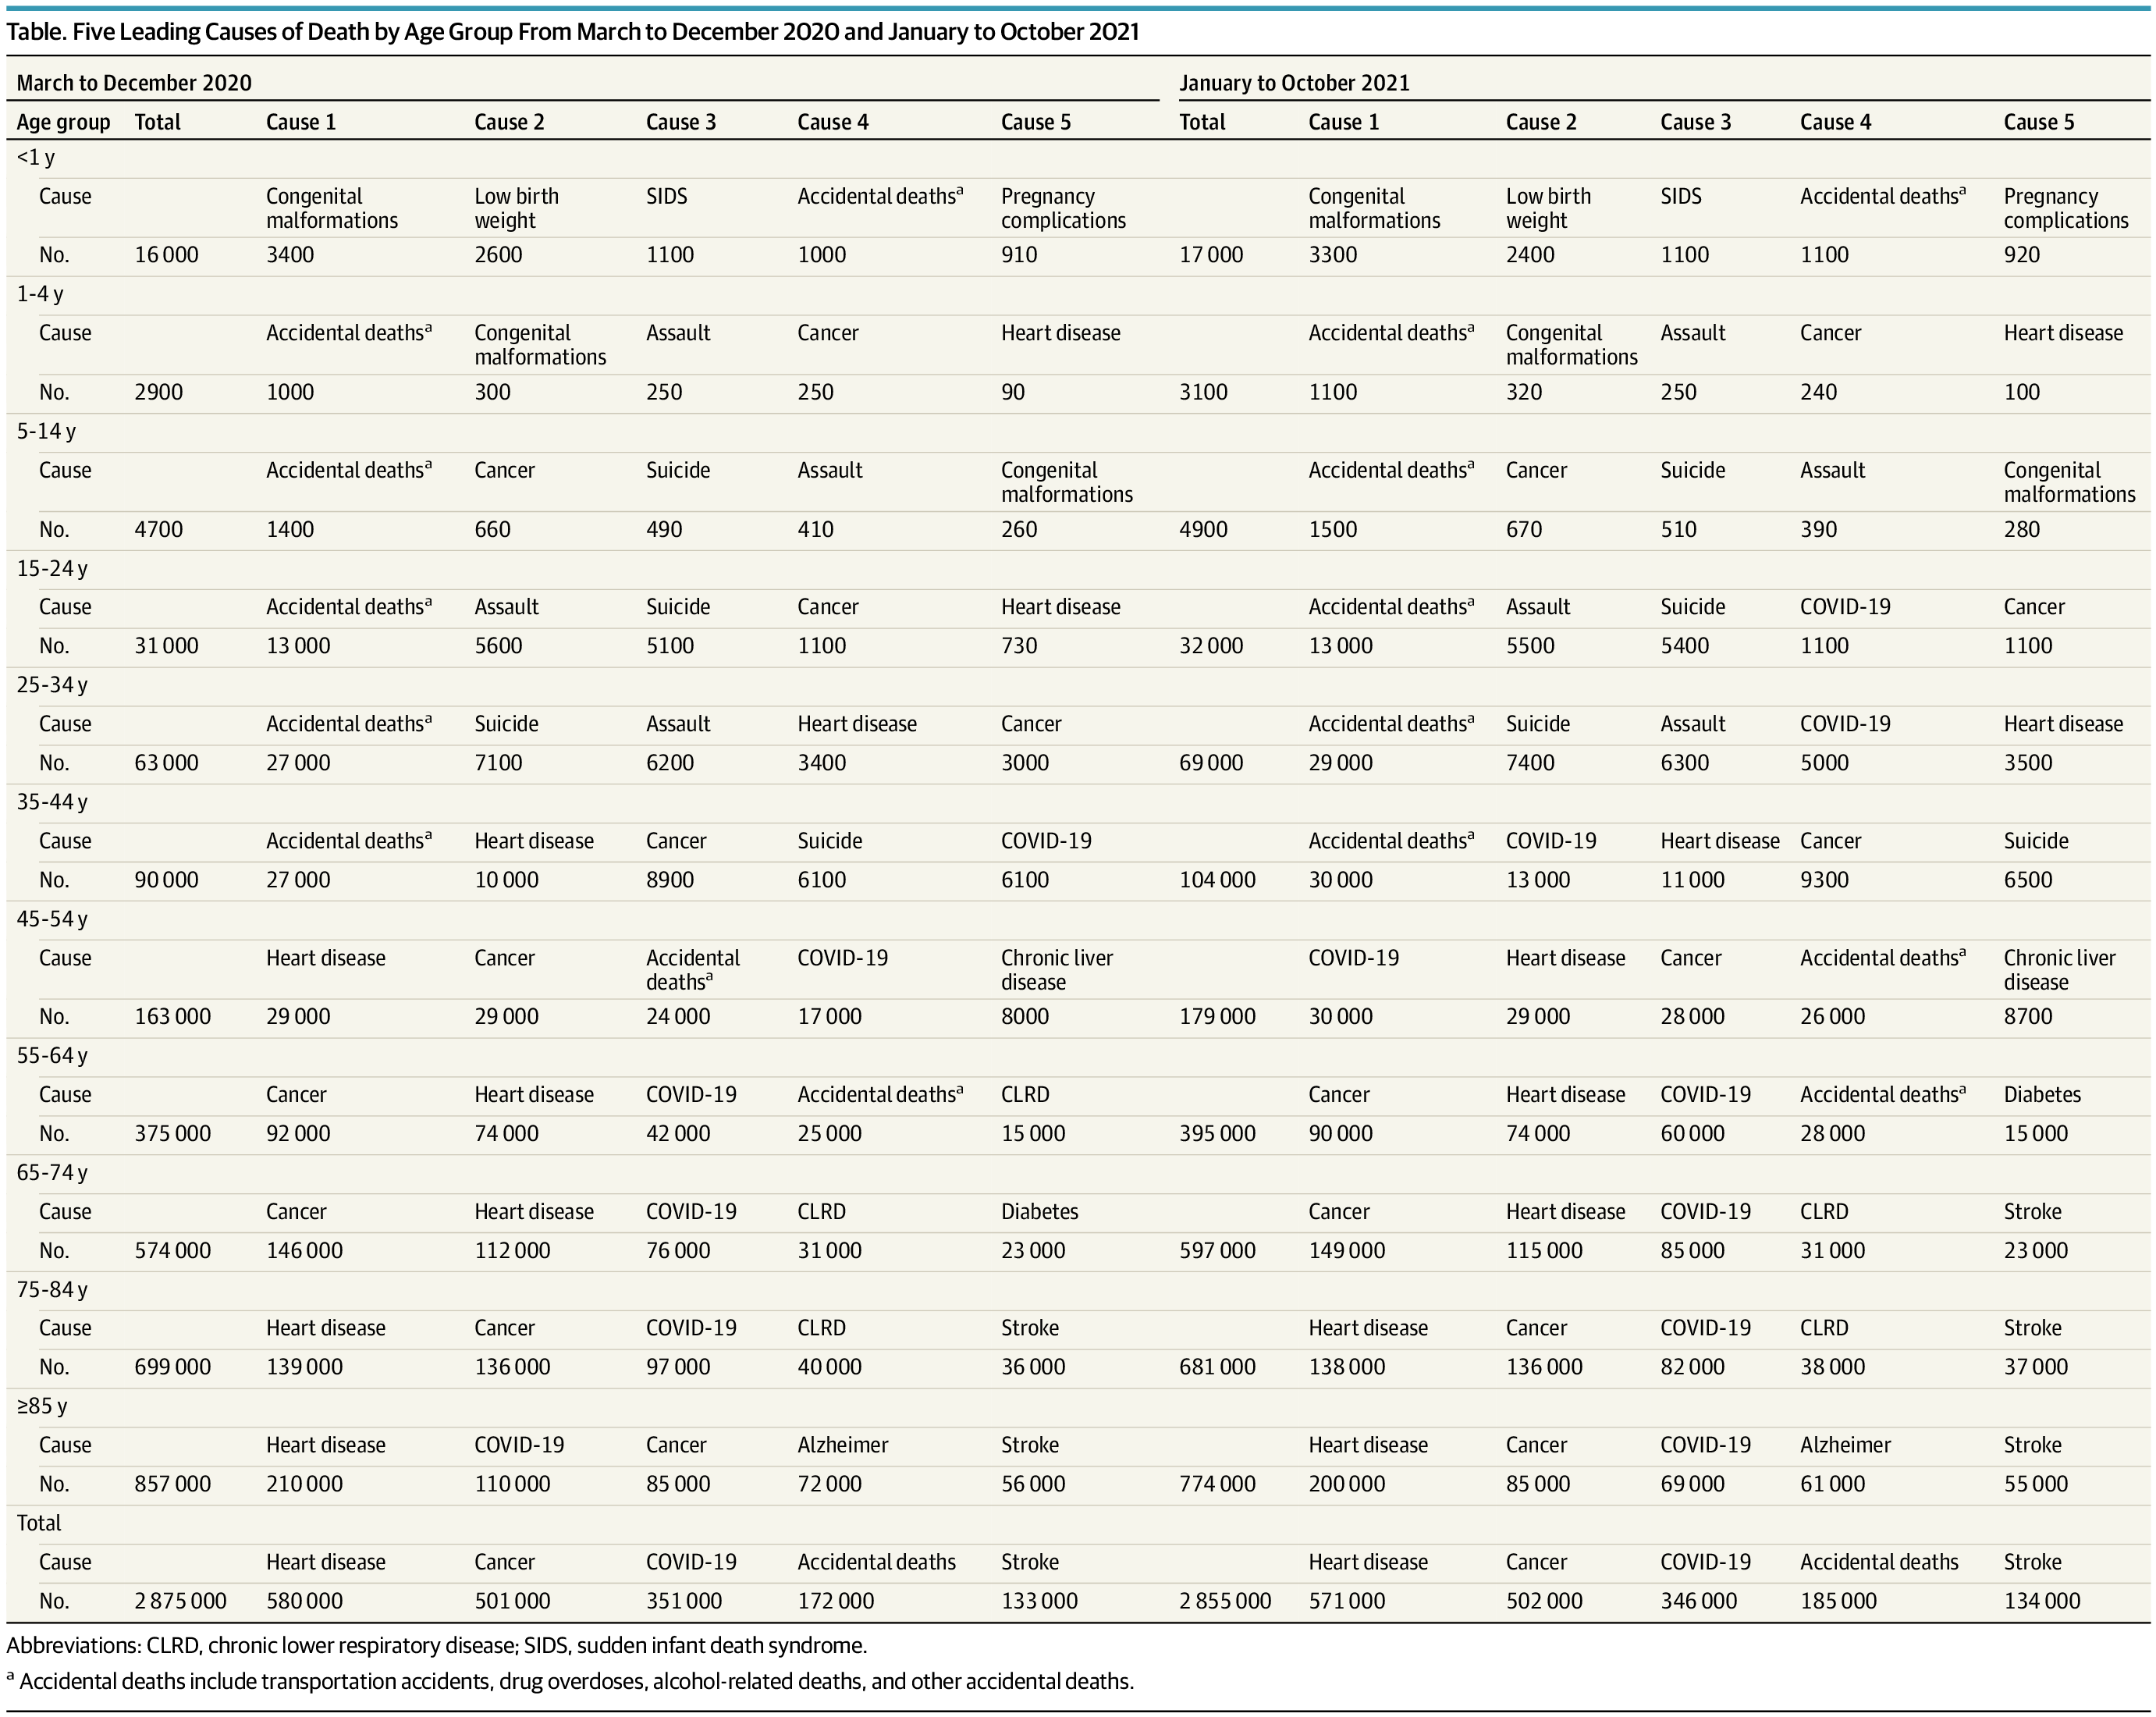
Graphic source: https://jamanetwork.com/journals/jama/fullarticle/2822207?guestAccessKey=d77e381f-2d53-417d-8bc9-d2ca2a11a709

Graphic source: https://jamanetwork.com/journals/jama/fullarticle/2822207?guestAccessKey=d77e381f-2d53-417d-8bc9-d2ca2a11a709

Graphic source: https://www.cdc.gov/nchs/products/databriefs/db492.htm
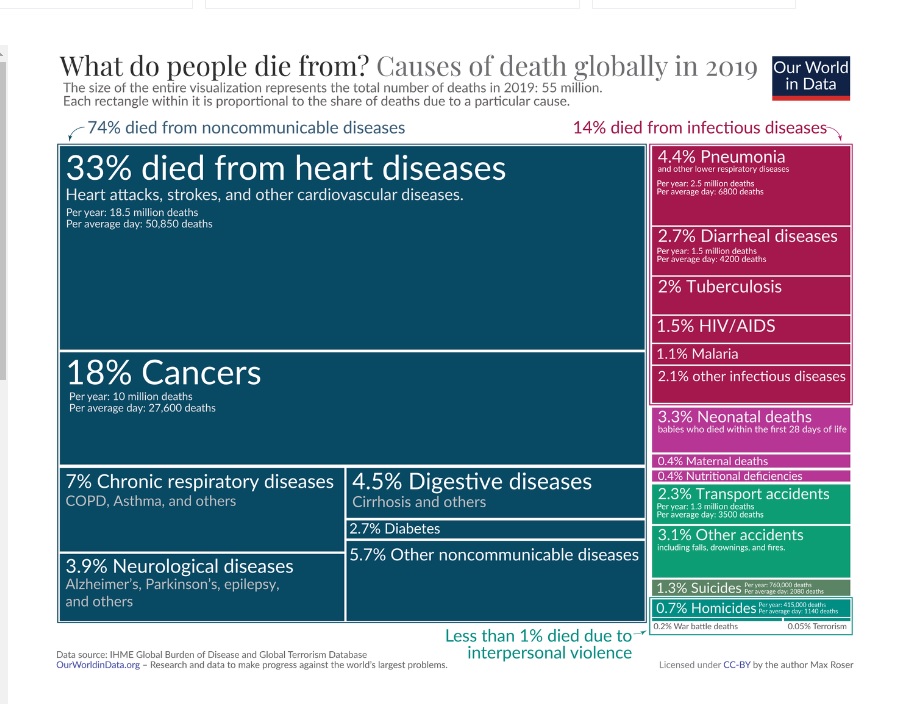
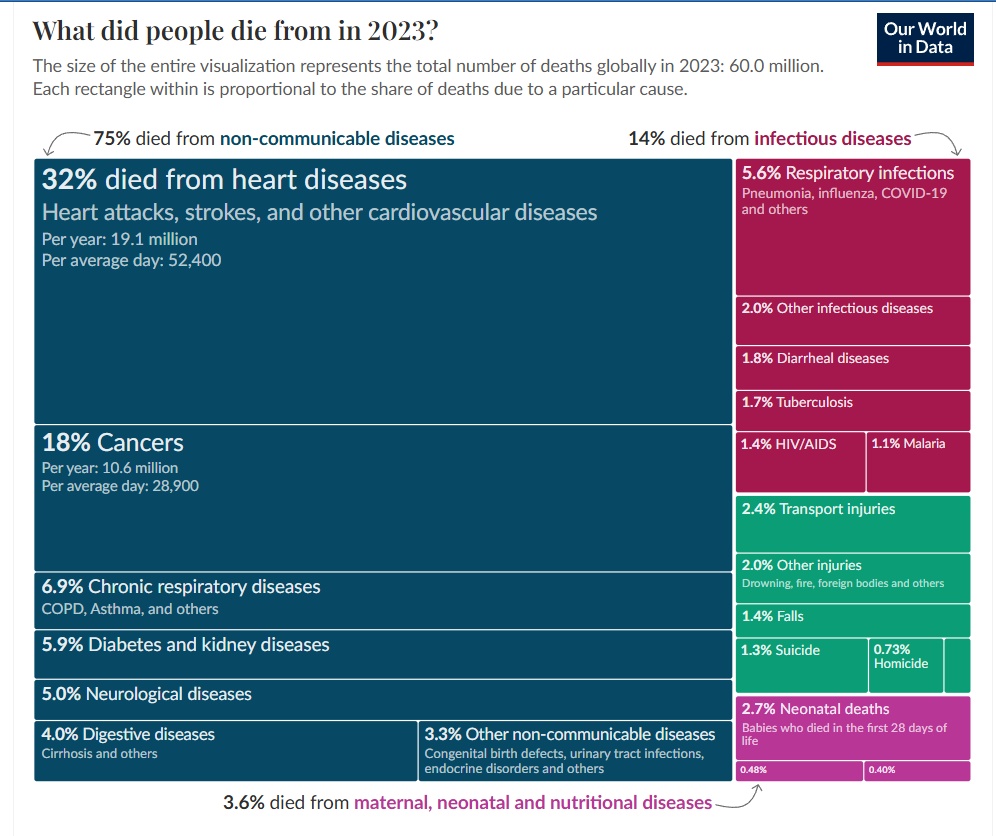
Graphic source: https://ourworldindata.org/cardiovascular-diseases

Graphic source: https://www.cdc.gov/mmwr/volumes/72/wr/mm7218a3.htm

 "
"
Graphic source: https://wisqars.cdc.gov/data/lcd/home
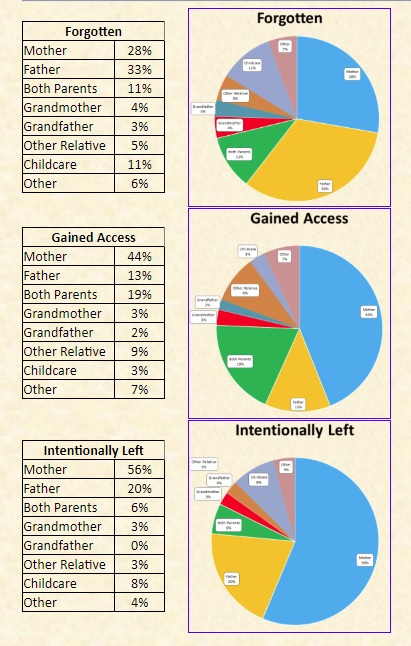
Graphic source: https://jamanetwork.com/journals/jamainternalmedicine/fullarticle/2794043

Graphic source: https://jamanetwork.com/journals/jamainternalmedicine/fullarticle/2794043

Graphic source: https://www.cdc.gov/nchs/data/databriefs/db427-tables.pdf#4

Graphic source: https://jamanetwork.com/journals/jama/fullarticle/2778234

Graphic source: https://wisqars-viz.cdc.gov:8006/lcd/home?ACSTrackingID=USCDC_20_5-DM48904&ACSTrackingLabel=2019%20Fatal%20and%20Nonfatal%20Injury%20Data%20Now%20Available%20_DM48904&deliveryName=USCDC_20_5-DM48904

Graphic source: https://www.who.int/gho/world-health-statistics

Graphic source: https://www.statista.com/chart/16647/the-lifetime-odds-of-dying-from-selected-causes/

Graphic source: http://www.healthdata.org/sites/default/files/files/infographics/Infographic_GBD2017-Risk-Factors-Highlights_2018.pdf

Graphic source: https://www.cdc.gov/nchs/data/hus/hus17.pdf#fig21
Age-adjusted death rates for the 10 leading causes of death in 2015: United States, 2014 and 2015

Graphic source: http://www.cdc.gov/nchs/products/databriefs/db267.htm

Graphic source: Enlarged Graphic

Graphic source: https://www.washingtonpost.com/news/to-your-health/wp/2016/05/03/researchers-medical-errors-now-third-leading-cause-of-death-in-united-states/

Graphic source: http://www.livescience.com/54429-deadliest-day-of-the-week.html?cmpid=NL_Health_weekly_2016-04-19

Graphic source: http://www.cdc.gov/injury/images/lc-charts/leading_causes_of_death_age_group_2014_1050w760h.gif

Map source: http://www.cdc.gov/pcd/issues/2015/14_0395.htm
Age-adjusted death rates for the 10 leading causes of death: United States, 2013 and 2014

Graphic source: http://www.cdc.gov/nchs/data/databriefs/db229.htm
What kills us, in one chart

Graphic source: http://www.vox.com/2014/11/16/7223443/causes-death-america

Graphic source: http://www.schwab.com/insights/retirement/thinking-forward-grow-your-retirement-savings
Number of Deaths from 10 Leading Causes,* by Sex National Vital Statistics System, United States, 2015

Graphic source: https://www.cdc.gov/mmwr/volumes/66/wr/mm6615a8.htm


