COVID-19 SeroHub To offer an interactive dashboard to visualize SARS-CoV-2 seroprevalence estimates over time and by geography, population, and other factors. NIH.gov
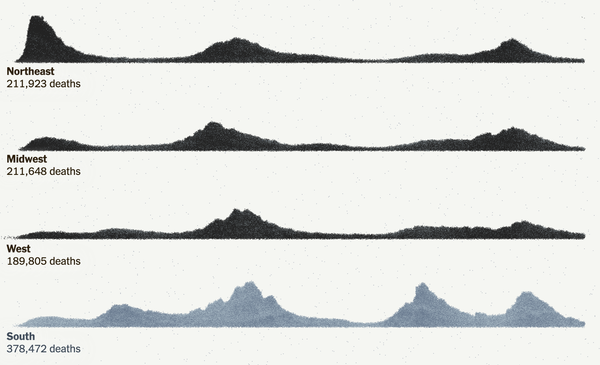
Graphic source: May 16, 2022 New York Times Coronavirus Briefing
Graphic source: May 16, 2022 New York Times Coronavirus Briefing
Graphic source: May 16, 2022 New York Times Coronavirus Briefing
Graphic source: May 16, 2022 New York Times Coronavirus Briefing
March 6, 2022 - 6 million Global Deaths
Graphic source: https://apnews.com/article/russia-ukraine-coronavirus-pandemic-science-business-health-69e8cbaebb653a0f1cb65ffe33d9afbd
Percentage of people in communities across the United States infected by the novel coronavirus that causes COVID-19 as of December 2020. Credit: Pei S, Nature, 2021.